Fill in the form to access the computer generated podcast version of this blog post.
Streamline your data analysis process with OLAP for better business intelligence. Explore the advantages of Online Analytical Processing (OLAP) now!
Do you find it challenging to analyze large volumes of data swiftly? A Forrester study reveals that data teams spend around 70% of their time preparing external data for analysis, leaving only 30% for actual data analysis. Online Analytical Processing (OLAP) is designed to address this imbalance by enabling rapid responses to complex queries. This guide explores how OLAP enhances business intelligence, focusing on tools and techniques that analysts and managers can use to make smarter decisions.
What is OLAP?
OLAP stands for Online Analytical Processing. It enables analysts to explore multidimensional data efficiently, supporting fast querying and complex calculations. Analysts often organize data in OLAP cubes, which they derive from data warehouses or other relational sources optimized for business intelligence.
Unlike Online Transaction Processing (OLTP) systems that focus on transactional efficiency, OLAP provides advanced querying capabilities by analyzing aggregated data, often extracted from OLTP systems. This makes OLAP a critical tool for business decision-making.
Core Features of OLAP Systems
Multidimensional Databases
Multidimensional databases organize data into OLAP cubes using schemas like star, snowflake, or fact constellation. These schemas include:
- Fact Tables: Store measurable data, such as sales figures.
- Dimension Tables: Contain descriptive attributes like time or product details.
- Conformed Dimensions: Best practice dimensions shared across multiple fact tables for consistency.
This structure enables efficient slicing, dicing, drill-down, and roll-up operations, providing detailed insights from aggregated data. Analysts use tools like Microsoft SQL Server Analysis Services (SSAS) to interact with these multidimensional databases.
Aggregations and Calculations
Aggregations summarize data using functions like SUM, AVG, and COUNT. These are pre-calculated and stored in OLAP cubes, enabling fast query performance. For example:
- Aggregated Measures: Provide key performance metrics, such as total sales or average revenue.
- Advanced Calculations: Simplify complex analysis tasks, making it easier for analysts to visualize trends and build dashboards.
Fast and Efficient Data Querying
OLAP systems are designed for quick query responses, supported by pre-calculated aggregations and optimized schemas. With tools like SSAS, analysts can navigate large data volumes seamlessly, improving query performance and decision-making. Popular OLAP tools often include built-in dashboard capabilities and integrate with visualization software for real-time reporting.
Widely used OLAP tools include Microsoft SQL Server Analysis Services (SSAS), IBM Cognos Analytics, and Oracle OLAP, along with enterprise platforms like SAP Business Warehouse (SAP BW). These tools support multidimensional analysis, dashboards, and reporting—often built on data pipelines automated by platforms like WhereScape.
Types of Online Analytical Processing Systems
Multidimensional OLAP (MOLAP)
MOLAP uses compressed, pre-aggregated data stored in multidimensional databases. This ensures:
- Fast Query Responses: Ideal for summary-level insights.
- Compact Design: Efficient data storage through compression.
Challenges include slower processing for extensive datasets and potential data redundancy. However, MOLAP remains a strong choice for its speed and aggregation capabilities.
Relational OLAP (ROLAP)
ROLAP in SSAS builds models over relational entities in data warehouses, populated by ELT pipelines. Key benefits include:
- Direct Querying: Data is queried directly from relational sources without requiring extensive pre-processing.
- Scalability: This solution works well for large datasets that store detailed information in relational tables.
Hybrid OLAP (HOLAP)
HOLAP combines the strengths of MOLAP and ROLAP by:
- Using pre-aggregated MOLAP data for summary-level queries.
- Leveraging ROLAP for detailed data stored in relational sources.
This approach reduces storage requirements while maintaining fast query responses for aggregated data. It is a versatile solution for balancing speed and scalability.
OLAP vs. Relational Databases for BI
While OLTP systems focus on transaction processing, relational databases optimized for BI/Data Warehousing differ significantly:
- Query Optimization: Designed for performance, with denormalization and indexing tailored for analytics.
- Data Aggregation: Supports pre-calculated measures, essential for OLAP operations.
OLAP systems build on these BI-optimized databases to deliver multidimensional analysis capabilities, making them essential for business intelligence.
How OLAP Works
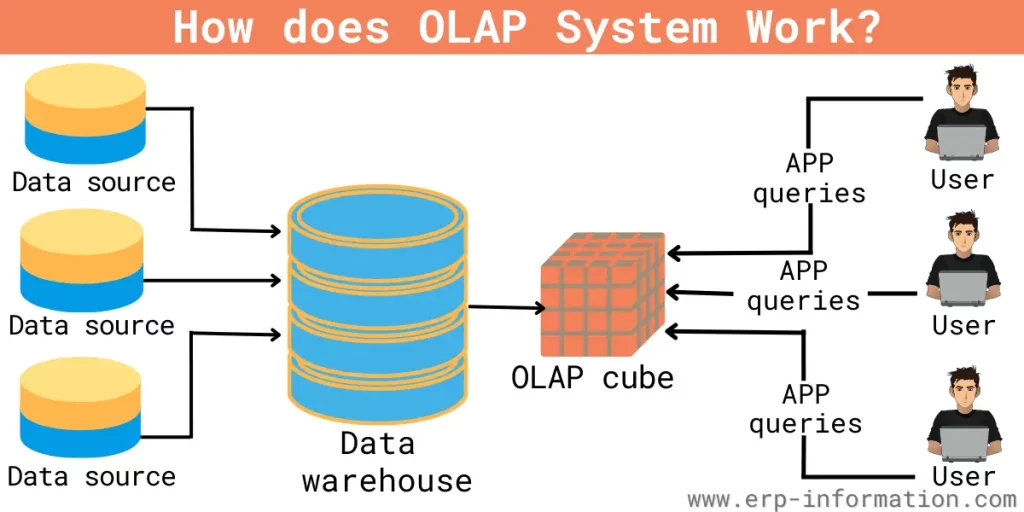
Data Collection and Storage
Data is collected from multiple sources and stored in centralized, multidimensional databases. OLAP systems typically pull structured information from diverse data sources, including ERP systems, CRM platforms, and marketing databases, consolidating them into a single analytical model.:
- Measures: Numeric data, such as sales.
- Dimensions: Descriptive attributes, such as time or region.
This setup allows analysts to access and analyze data interactively.
Creation of OLAP Cubes
OLAP cubes are created from fact and dimension tables, storing aggregated data and relationships for efficient querying. For example:
- Fact Tables: Include sales metrics.
- Dimension Tables: Provide context, such as time and geography.
SSAS enables analysts to build and interact with these cubes, delivering fast and reliable insights.
Benefits of Online Analytical Processing Systems
Enhanced Data Analysis
OLAP empowers analysts to explore data from multiple perspectives, such as by time, geography, or product. Aggregated measures and pre-calculated data make it easy to identify trends and answer complex questions quickly.
Improved Business Intelligence
By integrating data from various business functions, OLAP supports comprehensive decision-making. Its ability to analyze data across multiple dimensions enhances reporting, forecasting, and strategic planning. By combining powerful OLAP services with user-friendly interfaces like pivot tables, businesses can empower non-technical teams to explore data independently.
Operational Efficiency at Scale
OLAP systems are designed for performance. Pre-aggregated data cubes and optimized schemas significantly reduce query time, allowing analysts to get answers in seconds instead of minutes or hours. This efficiency not only speeds up decision-making but also reduces the burden on IT teams by minimizing the need for manual reporting or repetitive SQL queries.
Challenges in OLAP Implementation
Integration with Existing Systems
Integrating OLAP with data warehouses can be complex, especially for MOLAP systems that require extensive pre-aggregation. Choosing the right type of OLAP (MOLAP, ROLAP, or HOLAP) ensures smooth integration and optimal performance.
Managing Large Data Volumes
As datasets grow, efficient management becomes critical. OLAP systems must balance storage requirements and processing power to maintain performance while scaling with business needs.
Future Trends in OLAP Technology
The Rise of Columnar Databases
Columnar databases, known for their speed and storage efficiency, are gaining traction in modern OLAP implementations. While SSAS does not currently support these platforms, advancements in this area promise significant improvements in scalability.
Bringing It All Together: Why OLAP Still Matters
Online Analytical Processing (OLAP) remains a cornerstone of modern business intelligence. By enabling fast, multidimensional analysis across complex datasets, OLAP tools like SSAS empower organizations to make informed decisions with confidence. Whether you’re optimizing reports, forecasting performance, or uncovering trends, understanding how to apply OLAP’s core principles and technologies is key to staying competitive in today’s data-driven world.
Want to see it in action? Request a demo of WhereScape to explore how automation can streamline your OLAP workflows—from data integration to cube creation—faster and smarter.
About the Author
Kortney Phillips is the Marketing Manager at WhereScape, specializing in data automation strategies and technical content. She collaborates closely with data architects and engineers to translate complex data processes into accessible, actionable insights. Follow her on LinkedIn or check out more insights on the WhereScape blog.
FAQs
OLAP is a method of analyzing multidimensional data to support business intelligence. It allows for fast, interactive exploration using cubes, pivot tables, and visual tools.
OLAP tools include platforms like SSAS, Oracle OLAP, and Apache Kylin that let analysts create cubes, run queries, and visualize complex data.
Data cubes store pre-aggregated values across dimensions, making it easy to retrieve summary data, compare metrics, and identify trends.
OLAP focuses on analytical querying and data aggregation, while developers design OLTP for transactional operations such as inserts, updates, and deletes.
Companies use OLAP services to streamline reporting, create dashboards, and enable users to drill into large datasets quickly—all from integrated data sources.
OLAP services allow organizations to analyze large datasets across multiple dimensions. These services—offered by tools like Microsoft SSAS, Oracle OLAP, and SAP BW—help build data cubes, enable fast querying, and support decision-making across departments.
Pivot tables act as the user interface for OLAP cubes, letting analysts dynamically slice and dice data by different dimensions like time, geography, or product—without needing to write complex SQL queries.